Introduction
GRANTS are used to solicit, accept and record sponsor funds, enforce sponsor conditions, and report back to the sponsor based on sponsor's requirements (Umoja Glossary of Terms, 2017).
The United Nations Grants Dashboard is a joint effort by 14 UN entities to provide a comprehensive overview of current and historical UN grants in a clear and transparent manner. It is available to all United Nations staff as well as to Member States and other UN partners. The financial data is provided by Umoja![]() and updated every 24 hours.
and updated every 24 hours.
Access for UN Staff
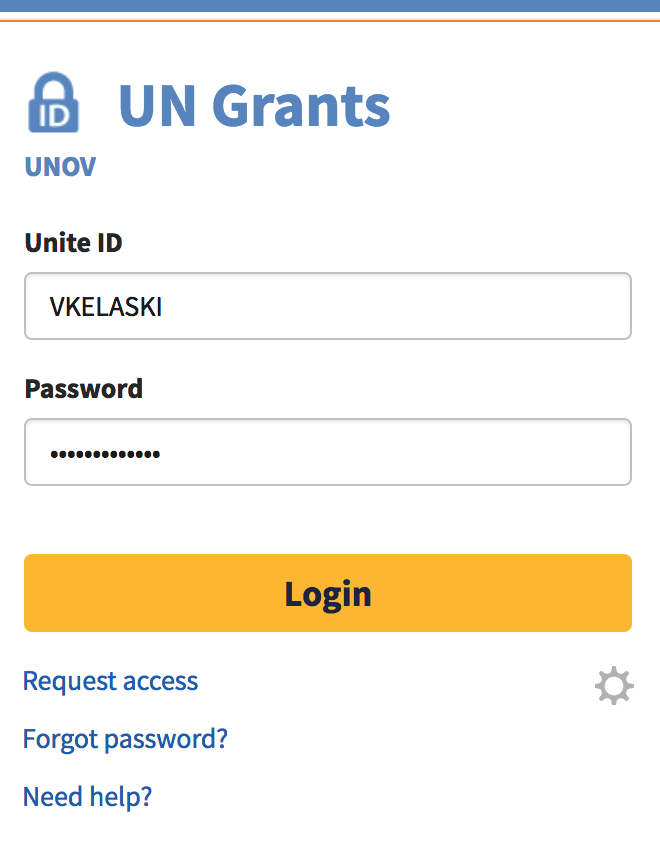
All UN staff members are authorized to use the UN Grants Dashboard to help them accomplish official functions. Simply use your Unite ID credentials to access the site. In case of any diffculties please contact our support team.
grants.un.org
Access for Member States
Third-party access to Grants Dashboard requires a valid External Account. You can request a personal external account as described below. Once your account has been activated, you will receive an email confirming your registration.

Dashboard Layout
The Dashboard is designed to be simple and intuitive. However, as with any software, it takes some effort to achieve proficiency. Below is a block diagram of main user interface components. Click on a component to jump to the corresponding chapter of this manual. Alternatively, you can continue scrolling down for a more gentle introduction to Dashboard features.

United Nations Grants
Donor contributions at a glance

-
UN EntityUNODC
-
Programmatic AreaAll
-
Sponsored ProgramAll
-
Sponsor GroupAll
-
SponsorAll
-
Sub SponsorAll
-
YearAll
-
GrantAll
Contributions to UNODC, Top 3 Sponsors
| Sponsor | Pledged, $ | % | Trend | |
|---|---|---|---|---|
| 1. | USA | 157,146,123 | 22.96 | |
| 2. | European Union | 151,756,053 | 22.17 | |
| 3. | Japan | 96,436,142 | 14.09 | |
| All other sponsors (112) | 279,241,225 | 40.79 | ||
| Σ | Total (115) | 684,579,543 | 100% |
Dimensions
The main control element of the Dashboard is the list of available data dimensions. The purpose of this component is to arrange dimensions in any desirable order. Dimensions which are more relevant to a specific business case are usually moved higher in the list. You could say that the arrangement of dimensions defines the general flow of your analysis. This simple mechanism enables you to navigate, filter and group grant information in a vast number of ways with very little effort.
Practice by arranging dimensions in suggested order:
-
UN Entity1
-
Programmatic Area2
-
Sponsored Program3
-
Sponsor Group4
-
Sponsor5
-
Sub Sponsor6
-
Year7
-
Grant8
Color Bands
Let's assume you have defined a good initial order of dimensions as described in the previous chapter. Next task is to gradually filter the data, one dimension after another, until the output meets your needs. This process is known as drilling down. To drill into the current dimension and advance to the next, simply click on one of the Color Bands. Below you can practice on a small dataset designed to help you grasp the idea. Note that the list of dimensions keeps track of your choices and indicates your current position.
"What are the three largest grants from Japan received in 2017 by UNODC?"
-
SponsorAll
-
YearAll
-
UN EntityAll
-
GrantAll
Top-k
Some configurations of the Dashboard can produce needlessly large results. For such cases, the Dashboard offers a control element called Top-k that allows to quickly remove clutter by grouping smaller items into a single block. In fact, this feature is so useful that it is enabled by default and configured to display top 10 items. The limit can be adjusted either by entering a different value in field or by choosing option to disable grouping completely and display the entire dataset.
Switch back and forth to illustrate the idea:
Overview Tab
The Dashboard would not be complete without data tables — after all, it is all about numbers! The table called Overview is shown by default for every possible configuration of the Dashboard and provides exact pledged amounts in USD along with two additional indicators, Percentage and Trend. It is easy to see that Overview table and color band chart are always in perfect sync and both sorted in descending order. Like color bands, Overview can be used for drilling down — you can click on its row to trigger a drill operation.
Move the cursor over table rows and color bands to see how they are related:
Contributions to UNODC, Top 3 Sponsors
| Sponsor | Pledged, $ | % | Trend | |
|---|---|---|---|---|
| 1. | USA | 157,146,123 | 22.96 | |
| 2. | European Union | 151,756,053 | 22.17 | |
| 3. | Japan | 96,436,142 | 14.09 | |
| All other sponsors (112) | 279,241,225 | 40.79 | ||
| Σ | Total (115) | 684,579,543 | 100% |
Projects Tab
The Funded Projects tab displays a list of UN projects in the scope of the current configuration of the Dashboard. A click on a Project ID opens a new browser window to the Programmatic Reporting Dashboard (projects.un.org
Contributions to UNODC by Switzerland in 2018
| UN Entity
|
Project ID
|
Project Title
|
Duration
|
Grant
|
Pledged, $
|
Collected, $
|
|---|---|---|---|---|---|---|
| UNODC | AFGF98 | Monitoring of opium production in Afghanistan | 2002-2017 | 2 grants | 2,914,820 | 2,916,046 |
| UNODC | AREU51 | Establishment of UNODC Sub Regional Office for the Gulf Cooperation Council Countries (GCC) | 2009-2016 | 3 grants | 2,233,713 | 2,237,873 |
| UNODC | BGDW54 | Assist the Government of Bangladesh to upgrade prison management systems through the establishment of a modern and advanced database for improved security in prisons | 2017-2018 | R1-32FSB-001513 | 1,207,221 | 72,320 |
| UNODC | BOLI79 | Sustainable and Integrated Management of the Natural Resources in the Tropics of Cochabamba and the Yungas of La Paz | 2006-2018 | 4 grants | 531,493 | 536,751 |
| UNODC | BOLV32 | Supporting the functioning of the UNODC Country Office Bolivia | 2013-2016 | 3 grants | 516,657 | 516,657 |
| UNODC | BOLW35 | Institutional transparency and citizen participation in local governance - Phase III | 2017-2020 | R1-32FSB-001389 | 2,100,105 | 973,366 |
| UNODC | BOLZ68 | Assistance Programme to the Implementation of the Action Plan for the Strategy for the Fight against Drug Trafficking and Reduction of Surplus Coca Cultivation, 2011 - 2015 | 2015-2019 | R1-32ADK-001084 | 608,839 | 0 |
| UNODC | BOLZ86 | Institutional transparency and citizen participation in local governance - Phase II | 2016-2017 | R1-32FSB-000977 | 247,617 | 240,385 |
| UNODC | COLC81 | Decentralization of the Masterplan in Drug Control in Colombia (Phase II) | 2000-2018 | 12 grants | 1,645,301 | 1,582,284 |
| UNODC | COLK53 | Support the implementation and monitoring of an integrated and sustainable strategy to reduce illicit crops and promote alternative development and a culture of legality in Colombia | 2011-2016 | 15 grants | 97,688,037 | 98,610,701 |
| Σ | Total (10) | 109,693,803 | 107,686,383 |
Grants Tab
As its name suggests, Grant Details tab displays a detailed list of grants under the current selection of dimensions. A click on a grant identifier opens the Grant Report pop-up which displays additional information about the grant. All columns are sortable. Try an interactive example below.
Contributions to UNODC in Terrorism Prevention by Japan in 2018
| UN Entity
|
Grant ID
|
Start date
|
End date
|
Sponsor
|
Substantive Office
|
Project ID
|
Pledged, $
|
Collected, $
|
Unpaid, $
|
|---|---|---|---|---|---|---|---|---|---|
| UNODC | R1-32FSB-001330 | 07/03/2017 | 31/03/2018 | Japan | UNODC DTA TPB | GLOR35 | 1,744,080 | 1,756,885 | 0 |
| UNODC | R1-32FSB-001325 | 07/03/2017 | 31/03/2018 | Japan | UNODC DTA TPB | GLOR35 | 1,312,650 | 1,321,389 | 0 |
| UNODC | R1-32FSB-000986 | 01/04/2016 | 31/03/2017 | Japan | UNODC DTA TPB | GLOR35 | 1,000,000 | 1,003,704 | 0 |
| UNODC | R1-32FSB-001324 | 07/03/2017 | 31/03/2018 | Japan | UNODC DTA TPB | GLOR35 | 994,000 | 1,000,483 | 0 |
| UNODC | R1-32FSB-001326 | 07/03/2017 | 31/03/2018 | Japan | UNODC DTA TPB | GLOR35 | 947,500 | 953,316 | 0 |
| UNODC | R1-32FSB-000984 | 01/04/2016 | 30/09/2017 | Japan | UNODC DTA TPB | 2 projects | 910,000 | 914,219 | 0 |
| UNODC | R1-32FSB-000981 | 01/04/2016 | 31/07/2017 | Japan | UNODC DTA TPB | GLOR35 | 600,000 | 601,608 | 0 |
| UNODC | R1-32FSB-000985 | 01/04/2016 | 30/09/2017 | Japan | UNODC DTA TPB | 2 projects | 540,000 | 542,402 | 0 |
| UNODC | R1-32FSB-000987 | 01/04/2016 | 31/03/2017 | Japan | UNODC DTA TPB | GLOR35 | 500,000 | 501,340 | 0 |
| UNODC | R1-32FSB-001319 | 07/03/2017 | 31/03/2018 | Japan | UNODC DTA TPB | GLOR35 | 500,000 | 503,603 | 0 |
| Σ | Total (10) | 9,048,230 | 9,098,949 | 0 |
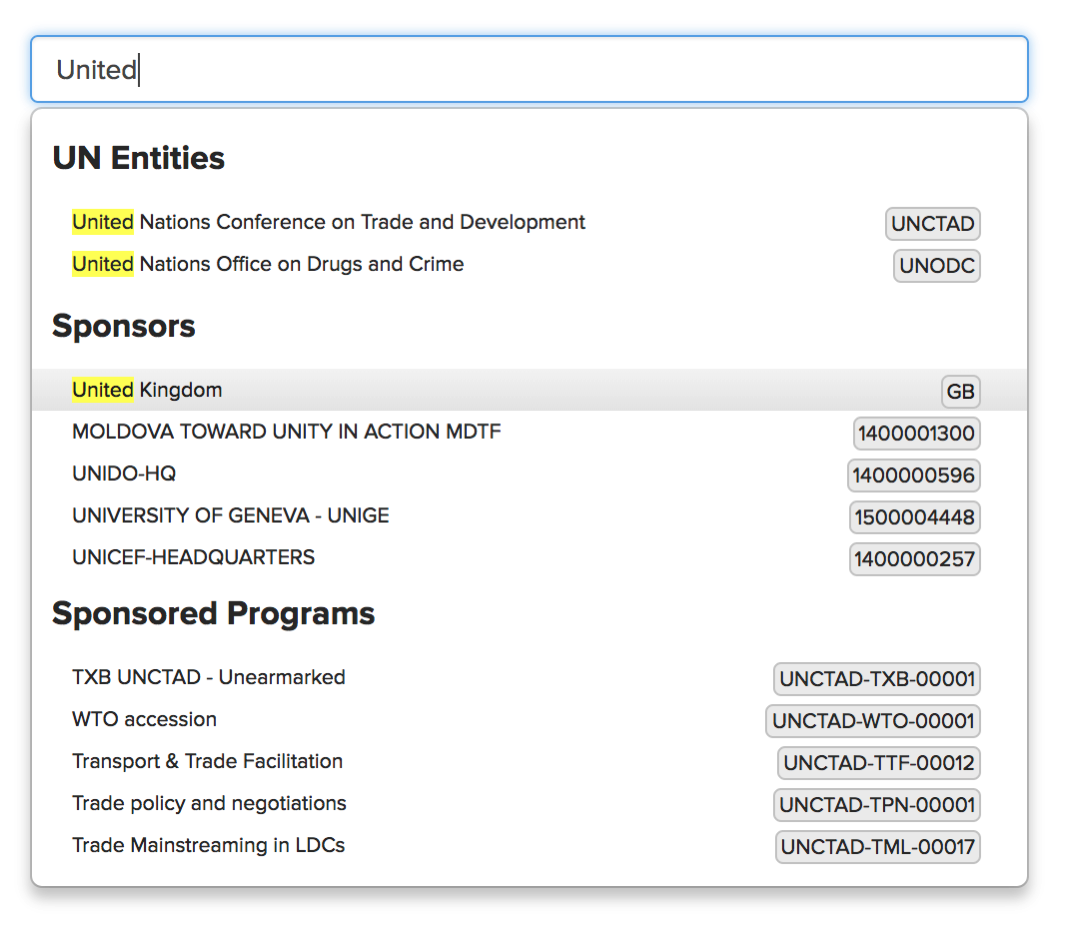
Search Bar
The Dashboard comes with a powerful search function. A search query is matched against descriptions and identifiers of all data items across all dimensions. Depending on the type of selected search result, the corresponding dimension is automatically pushed to the top of the dimension list and drilled to the selected value. For example, selecting United Kingdom from the Sponsors category instantly configures the Dashboard to focus on UK grants.
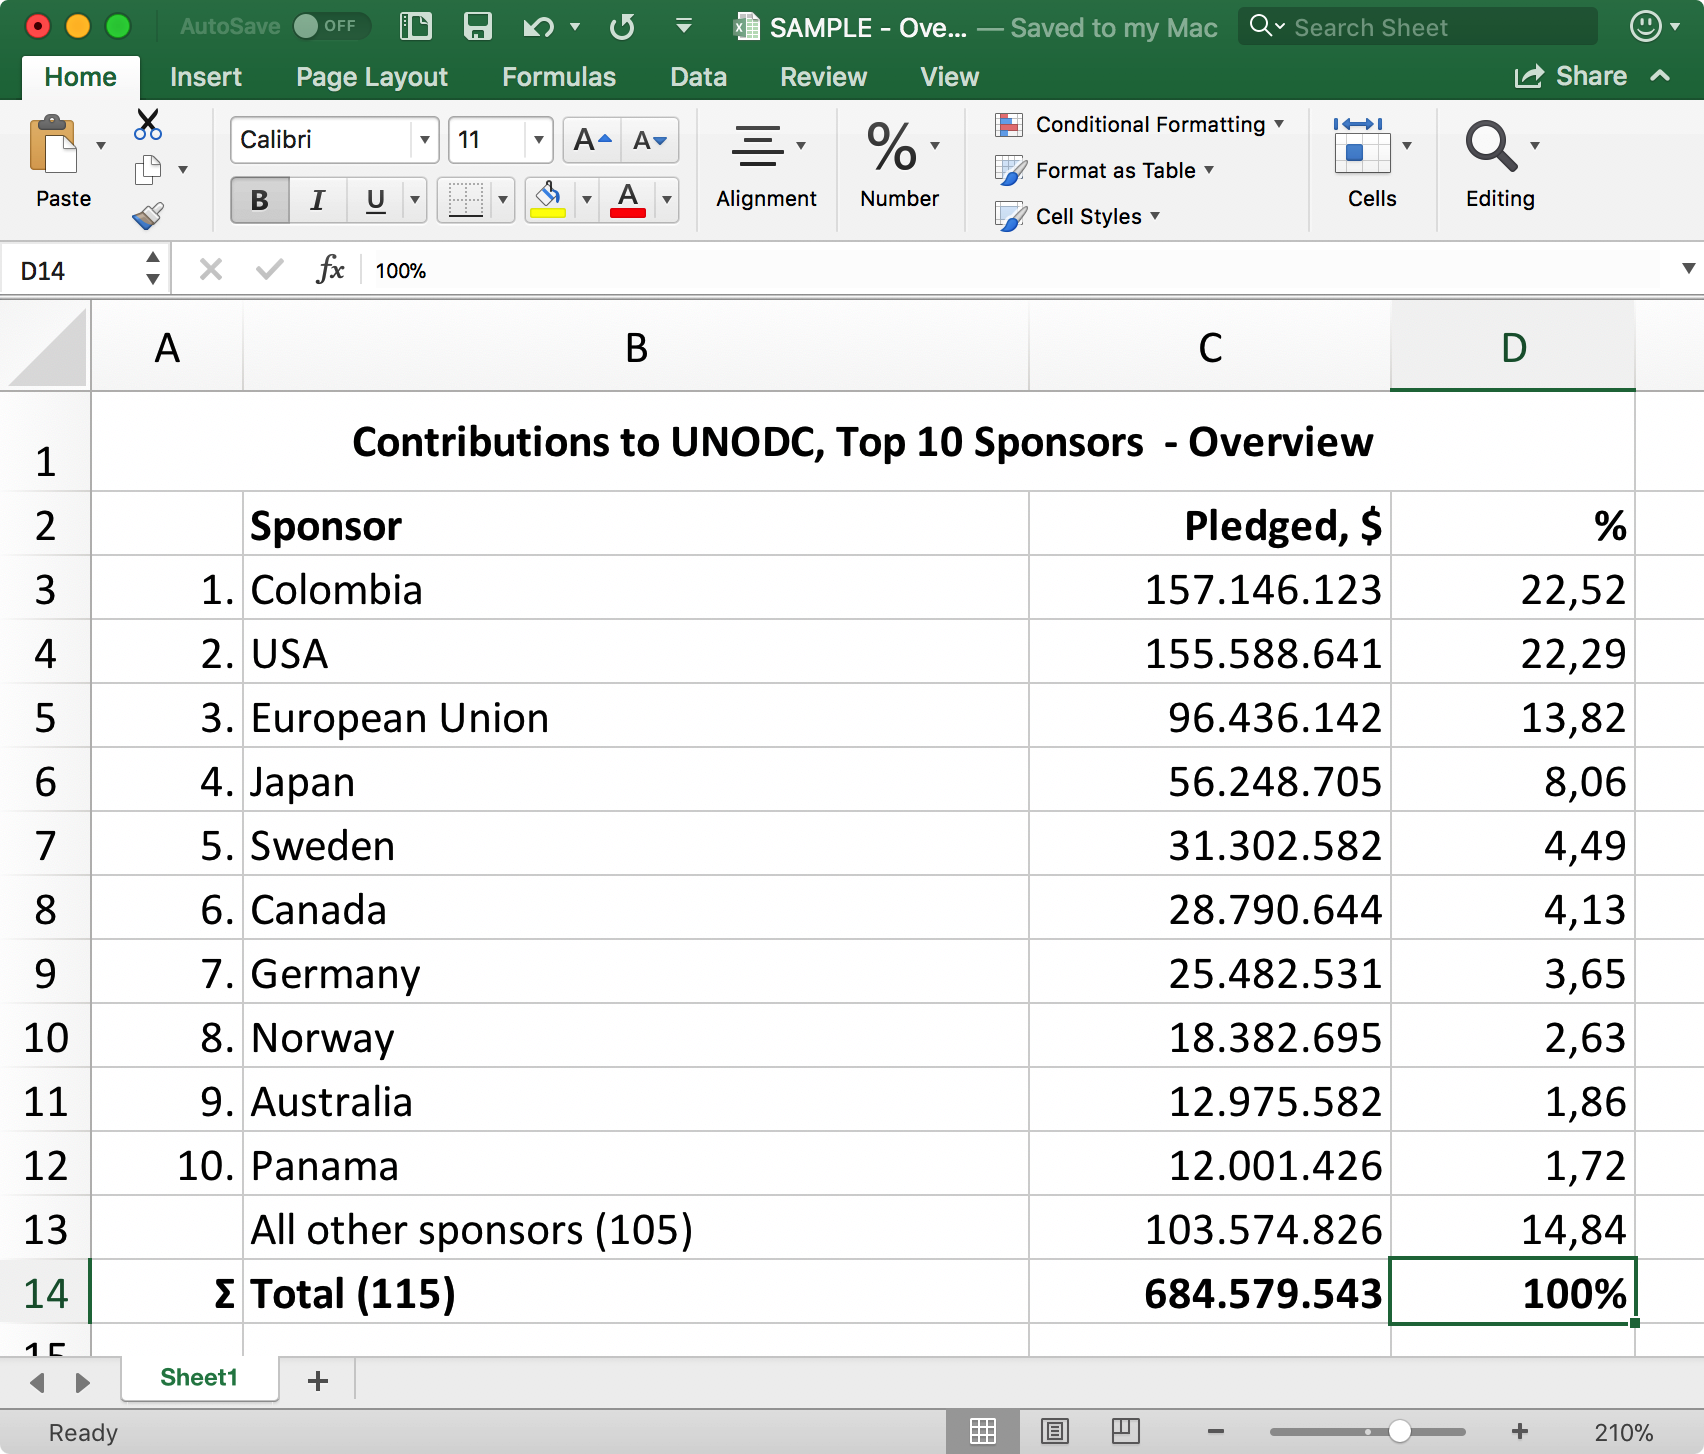
Data Export
Any Dashboard table can be exported to Microsoft Excel by clicking theicon at the top-right corner of the data view. The header of the generated spreadsheet reflects the exact configuration of the Dashboard at the time of export. The timestamp of the data snapshot is included in the file name. You can test the export function using the sample dataset below.
Contributions to UNODC, Top 10 Sponsors
| Sponsor | Pledged, $ | % | |
|---|---|---|---|
| 1. | Colombia | 157,146,123 | 22.52 |
| 2. | USA | 155,588,641 | 22.29 |
| 3. | European Union | 96,436,142 | 13.82 |
| 4. | Japan | 56,248,705 | 8.06 |
| 5. | Sweden | 31,302,582 | 4.49 |
| 6. | Canada | 28,790,644 | 4.13 |
| 7. | Germany | 25,482,531 | 3.65 |
| 8. | Norway | 18,382,695 | 2.63 |
| 9. | Australia | 12,975,582 | 1.86 |
| 10. | Panama | 12,001,426 | 1.72 |
| All other sponsors (105) | 103,574,826 | 14.84 | |
| Σ | Total (115) | 684,579,543 | 100% |
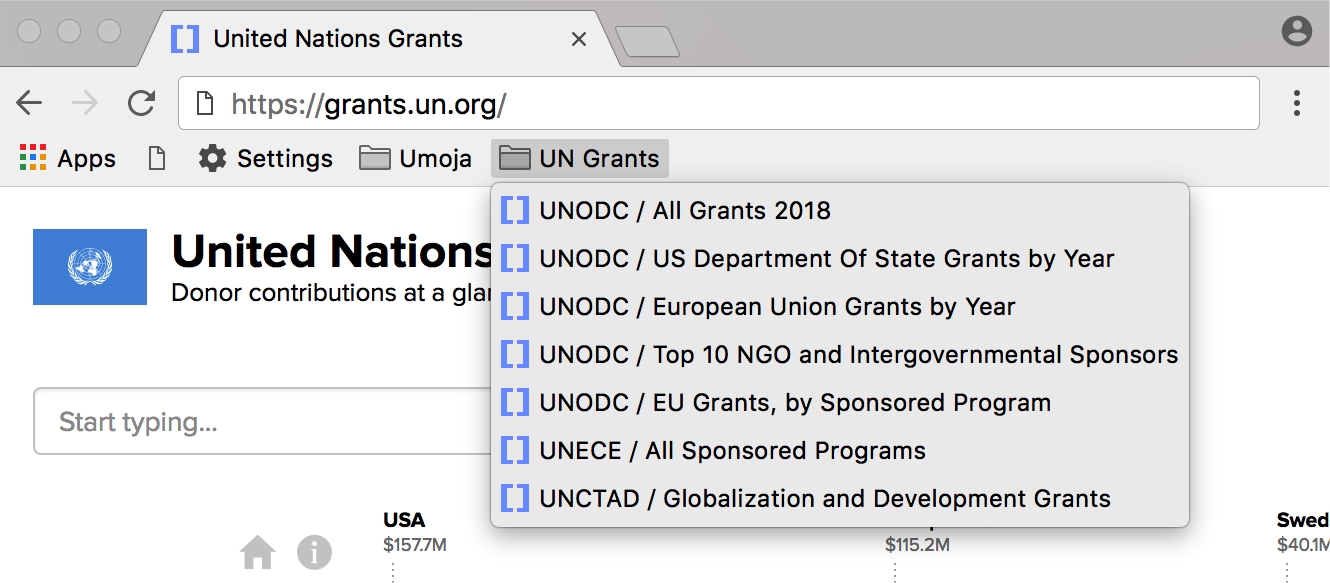
Bookmarks and Sharing
A configuration of the Dashboard is a specific combination of dimension order, drilldown state and Top-k setting. It is possible to store any configuration so that it can be instantly revisited in the future. For that, simply use your browser’s native bookmarking function (Ctrl+D on PC,+D on Mac). To keep your grant data views organized, consider creating a dedicated bookmark folder as shown below. A related feature is the button which copies the web address of the current Dashboard configuration to your clipboard. This enables your colleagues to access and bookmark data views you have created.
Glossary Mode
Clear definitions of relevant terms and concepts are the key to correct interpretation of data. The Dashboard is complete with integrated Glossary mode which can be invoked at any time by clickingicon. While in Glossary mode, the normal operation is suspended and your current view is populated with tooltips pointing to items for which a glossary entry is available. Click on a tooltip to expand the full text. Click anywhere else to exit Glossary and resume your session.
Try Glossary mode in action:
-
UN EntityAll
-
Programmatic AreaAll
-
Sponsored ProgramAll
-
Sponsor GroupAll
-
SponsorAll
-
Sub SponsorAll
-
YearAll
-
GrantAll
Get Involved
The UN Grants Dashboard relies on your feedback in order to grow and improve. Should you encounter any usability issues, data discrepancies, lack of functionality or other problems, please let us know.
 grants@un.org
We hope you found the UN Grants Manual useful and informative.
![]()